Carbon Footprint Comparison
How does pyrolysis compare to other waste management methods? The data is clear — pyrolysis has a dramatically lower carbon footprint than landfill and incineration, and biomass pyrolysis can actually be carbon-negative:
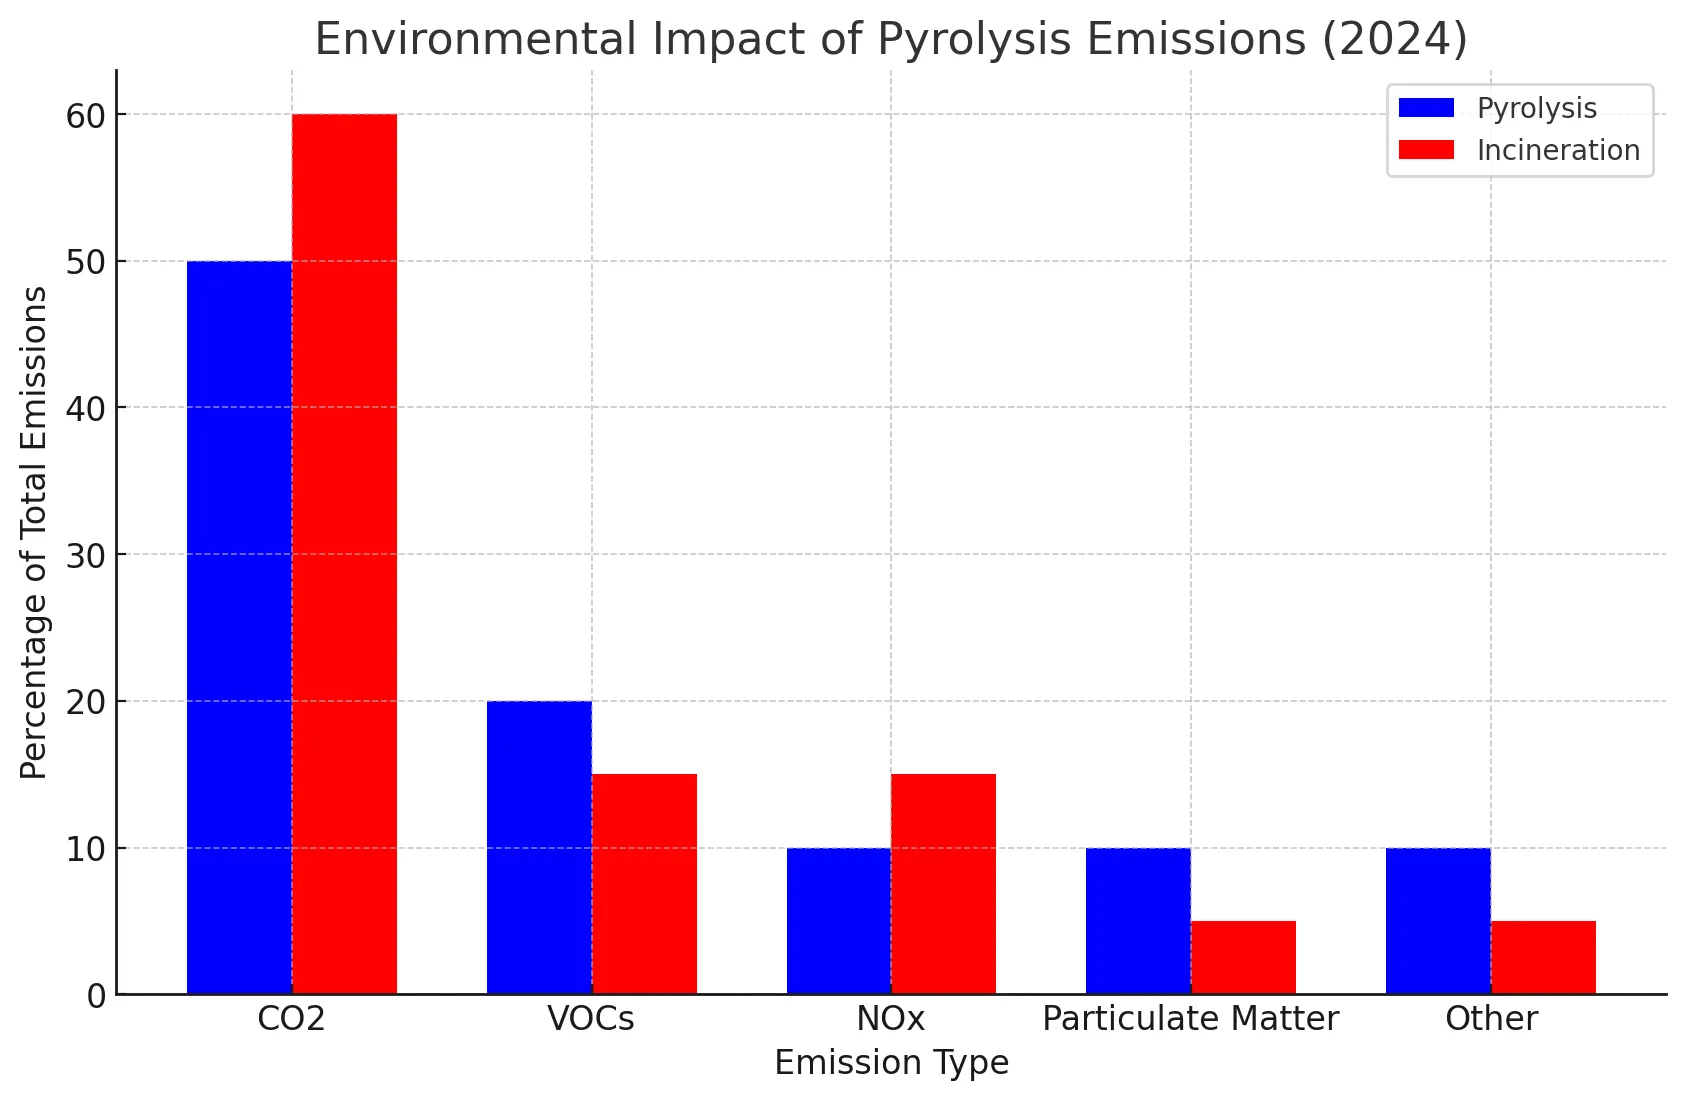
CO₂ Emissions by Waste Treatment Method
kg CO₂ equivalent per kg of waste processed (lifecycle basis)
Open Dumping / Landfill
Incineration (Energy Recovery)
Cement Co-Processing
Pyrolysis (Plastic to Oil)
Pyrolysis (Biomass to Biochar)
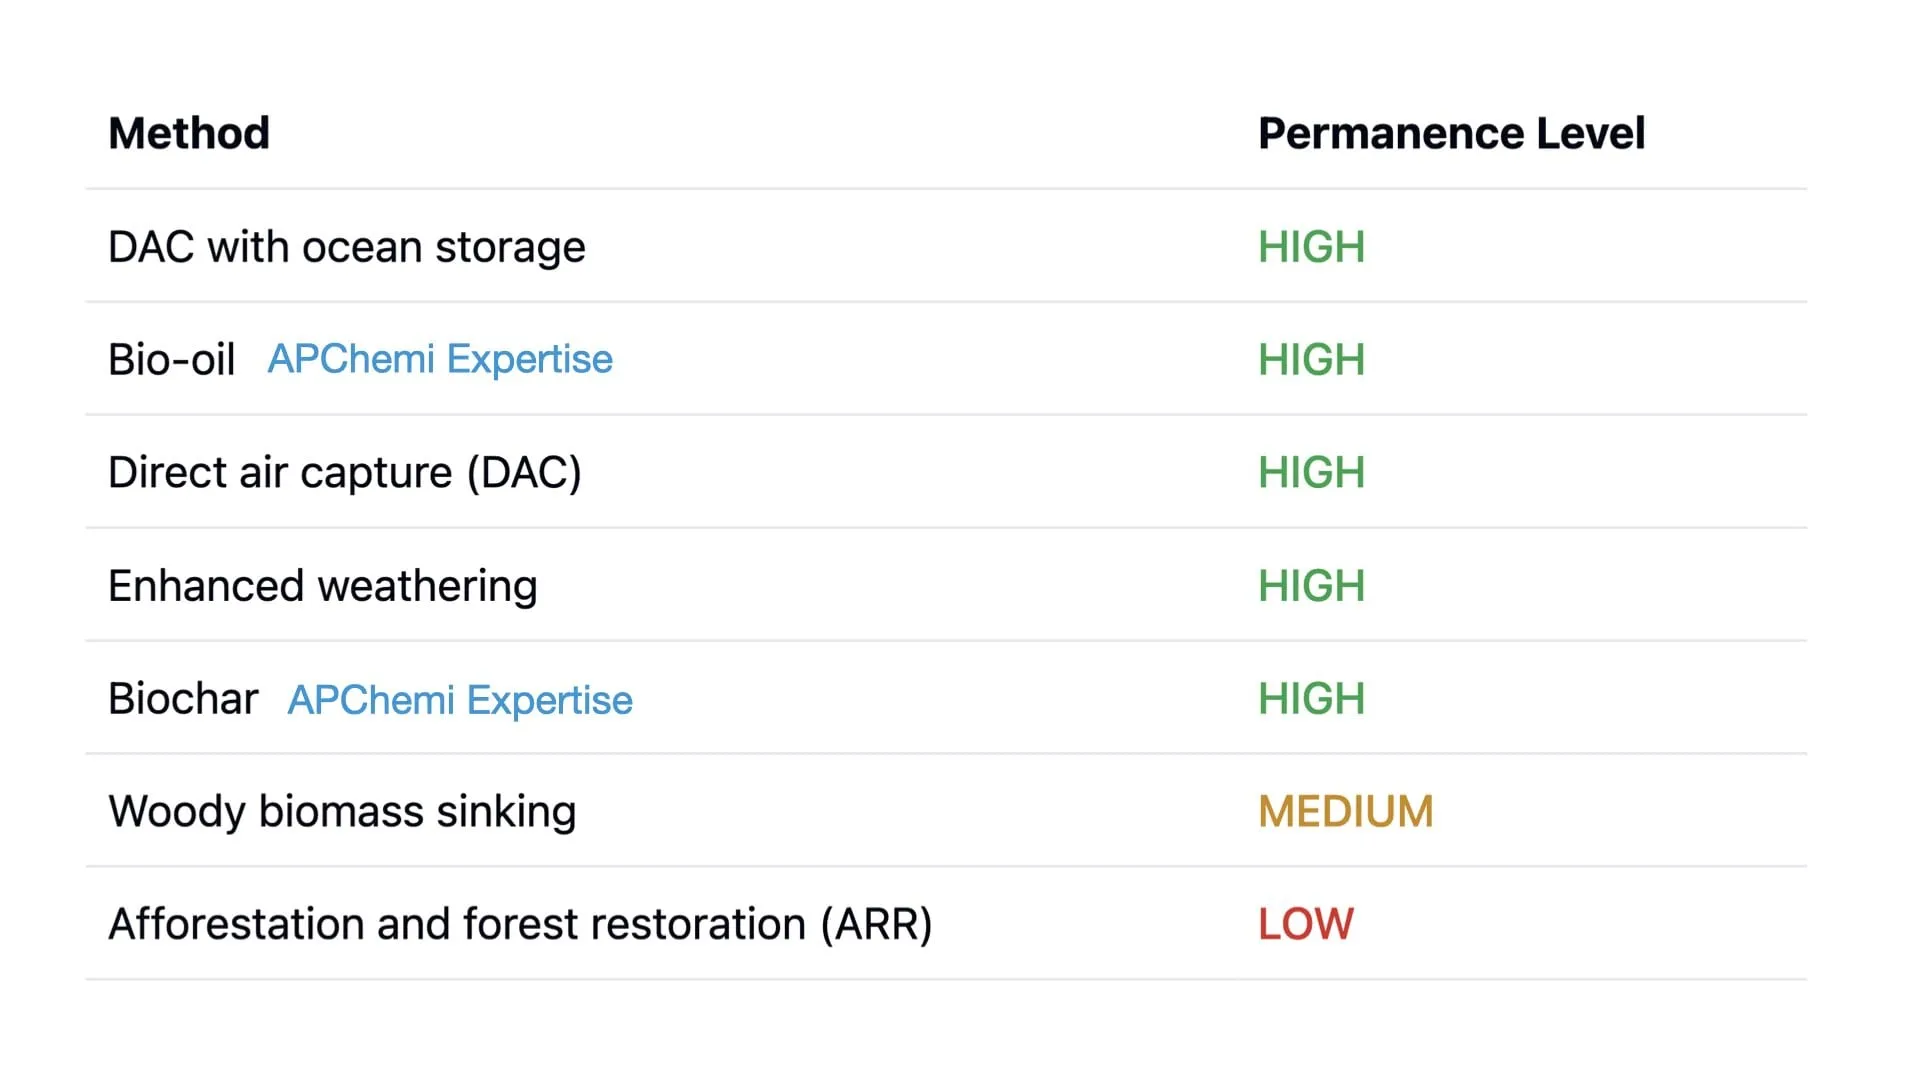
Key insight: Biomass pyrolysis produces biochar that locks carbon underground for centuries, resulting in net-negative emissions — a recognized Carbon Dioxide Removal (CDR) pathway.
Quantified Environmental Benefits
Each metric below represents a measurable environmental advantage that can be reported to regulators, included in ESG disclosures, and monetized through carbon credit programs:
Waste Diversion
of feedstock diverted from landfill or incineration
Every ton of waste pyrolysed is a ton that doesn't end up in landfill, ocean, or incinerator. A 20 TPD plant diverts 6,000+ tons per year.
GHG Reduction
lower emissions vs landfill/incineration
Pyrolysis avoids methane from landfill decomposition and reduces CO₂ compared to incineration. Net lifecycle emissions are significantly lower.
Virgin Fossil Displacement
oil yield from plastic pyrolysis
Pyrolysis oil from plastic replaces crude oil derivatives. Each ton of recovered oil displaces ~3 tons of CO₂ from virgin production.
Carbon Sequestration
per ton of biochar from biomass
Biochar locks carbon in a stable form for 100+ years. This is a recognized Carbon Dioxide Removal (CDR) pathway under carbon credit standards.
Water Protection
process water discharge (closed loop)
Modern pyrolysis plants operate with closed-loop water systems. No process water is discharged — protecting local waterways from contamination.
Energy Recovery
of feedstock energy recovered as products
Syngas produced during pyrolysis heats the reactor, making the process partially self-sufficient. Total energy recovery across all products is 85-95%.
Need environmental impact data for your project's permitting application or ESG report? APChemi provides detailed lifecycle analysis and emission profiles based on actual plant performance data from 49+ projects.
Lifecycle Environmental Analysis
Understanding the environmental impact at each stage of the pyrolysis process helps identify optimization opportunities and supports environmental impact assessments (EIA):
Feedstock Collection
Positive ImpactRemoves waste from environment, prevents landfill emissions and ocean pollution
Pre-Processing
Low ImpactShredding and drying use moderate energy. Washing (plastics) requires water treatment
Pyrolysis Reaction
Low-Medium ImpactThermal process uses energy, but syngas recirculation makes it partially self-sufficient
Product Recovery
Positive ImpactOil, char, and gas recovered as valuable products that displace virgin materials
Emission Control
Managed ImpactScrubbers, condensers, and thermal oxidizers ensure emissions meet regulatory limits
Product Use
Positive ImpactPyrolysis oil replaces crude-derived fuels/chemicals. Biochar sequesters carbon long-term
Pyrolysis vs Alternative Waste Methods
Regulators and investors increasingly compare pyrolysis to all available waste management options. Here's how they stack up across key environmental metrics:
| Environmental Factor | Landfill | Incineration | Mech. Recycling | Pyrolysis |
|---|---|---|---|---|
| GHG Emissions | Very High | High | Low | Low / Negative* |
| Material Recovery | None | None (energy only) | High | High (oil + char) |
| Toxic Emissions | Methane, leachate | Dioxins, furans | Minimal | Minimal (with controls) |
| Feedstock Flexibility | All waste | All combustible | Clean, sorted only | Mixed / contaminated OK |
| Carbon Credit Eligible | No | No | Limited | Yes (esp. biochar CDR) |
| ISCC Certifiable | No | No | Yes (limited) | Yes (full chain) |
| Waste Hierarchy Level | Lowest | Recovery | Recycling | Recycling |
* Biomass pyrolysis with biochar can achieve net-negative emissions via carbon sequestration
Carbon Credits & Monetizing Environmental Impact
The environmental benefits of pyrolysis aren't just good for the planet — they can be monetized. Multiple carbon credit pathways are available depending on your feedstock and products:
Biochar Carbon Removal (CDR)
Highest value carbon credit pathway
Revenue example: A 20 TPD biomass plant producing 7 t/day biochar generates ~6,400 tCO₂ credits/year = $500K-$1.3M+ annual revenue from carbon credits alone.
ISCC Plus Certification
Premium pricing for certified recycled content
Revenue example: A 20 TPD plastic pyrolysis plant with ISCC certification earns $200-$400/ton premium on oil sales = $800K-$1.6M+ additional annual revenue.
🌍 Voluntary Carbon Market
Sell carbon credits to corporations meeting net-zero pledges. Growing market expected to reach $50B+ by 2030.
$30-$100+ per tCO₂
🇪🇺 EU ETS Compliance
CBAM and EU ETS create carbon cost for industries. Biochar/recycled content reduces compliance costs for buyers.
€60-€100+ per tCO₂
♻️ Plastic Credits
Emerging market for certified plastic waste processing. Each ton of plastic recycled via pyrolysis generates plastic credits.
$50-$150 per ton plastic
Emission Control Systems
Modern pyrolysis plants are designed with comprehensive emission control systems that ensure compliance with the strictest environmental regulations:
Multi-Stage Emission Control System
Condensation
Multi-stage condensers capture oil vapor at different temperature ranges, maximizing oil recovery and minimizing vapor emissions.
Gas Scrubbing
Wet and dry scrubbers remove particulates, sulfur compounds, and acid gases from non-condensable gases.
Thermal Oxidizer
Residual non-condensable gas is burned at 800-1000°C, destroying VOCs and converting them to CO₂ and water.
Stack Monitoring
Continuous Emission Monitoring Systems (CEMS) track NOx, SOx, PM, and CO₂ in real-time for regulatory compliance.
Regulatory Landscape
Pyrolysis regulation varies by region but is trending favorable globally as governments recognize its role in circular economy and waste management:
European Union
- ✓ Chemical recycling recognized in EU Packaging and Packaging Waste Regulation
- ✓ ISCC Plus widely accepted for mass balance certification
- ✓ Industrial Emissions Directive (IED) sets emission limits
- ✓ CBAM creates carbon cost advantage for recycled content
United States
- ✓ Multiple states classifying pyrolysis as manufacturing (not waste disposal)
- ✓ EPA considering chemical recycling in recycling rate calculations
- ✓ Clean Air Act permits required; state environmental agency oversight
- ✓ IRA (Inflation Reduction Act) incentives for clean energy projects
India
- ✓ EPR (Extended Producer Responsibility) creates plastic recycling mandate
- ✓ CPCB/SPCB environmental clearances required
- ✓ Swachh Bharat and waste-to-wealth initiatives supporting pyrolysis
- ✓ Carbon credit trading scheme (CCTS) being developed
Rest of World
- ✓ ASEAN countries adopting waste-to-energy frameworks
- ✓ Middle East petrochemical companies investing in chemical recycling
- ✓ Australia classifying biochar as eligible for ERFs (Emissions Reduction Fund)
- ✓ UN Plastic Treaty negotiations supporting chemical recycling technologies
ESG Reporting & Sustainability Metrics
If you're operating or investing in a pyrolysis plant, these are the key environmental KPIs to track and report:
Key Environmental KPIs for Pyrolysis Operations
Powered by APChemi — Engineering Sustainable Pyrolysis Solutions
Frequently Asked Questions
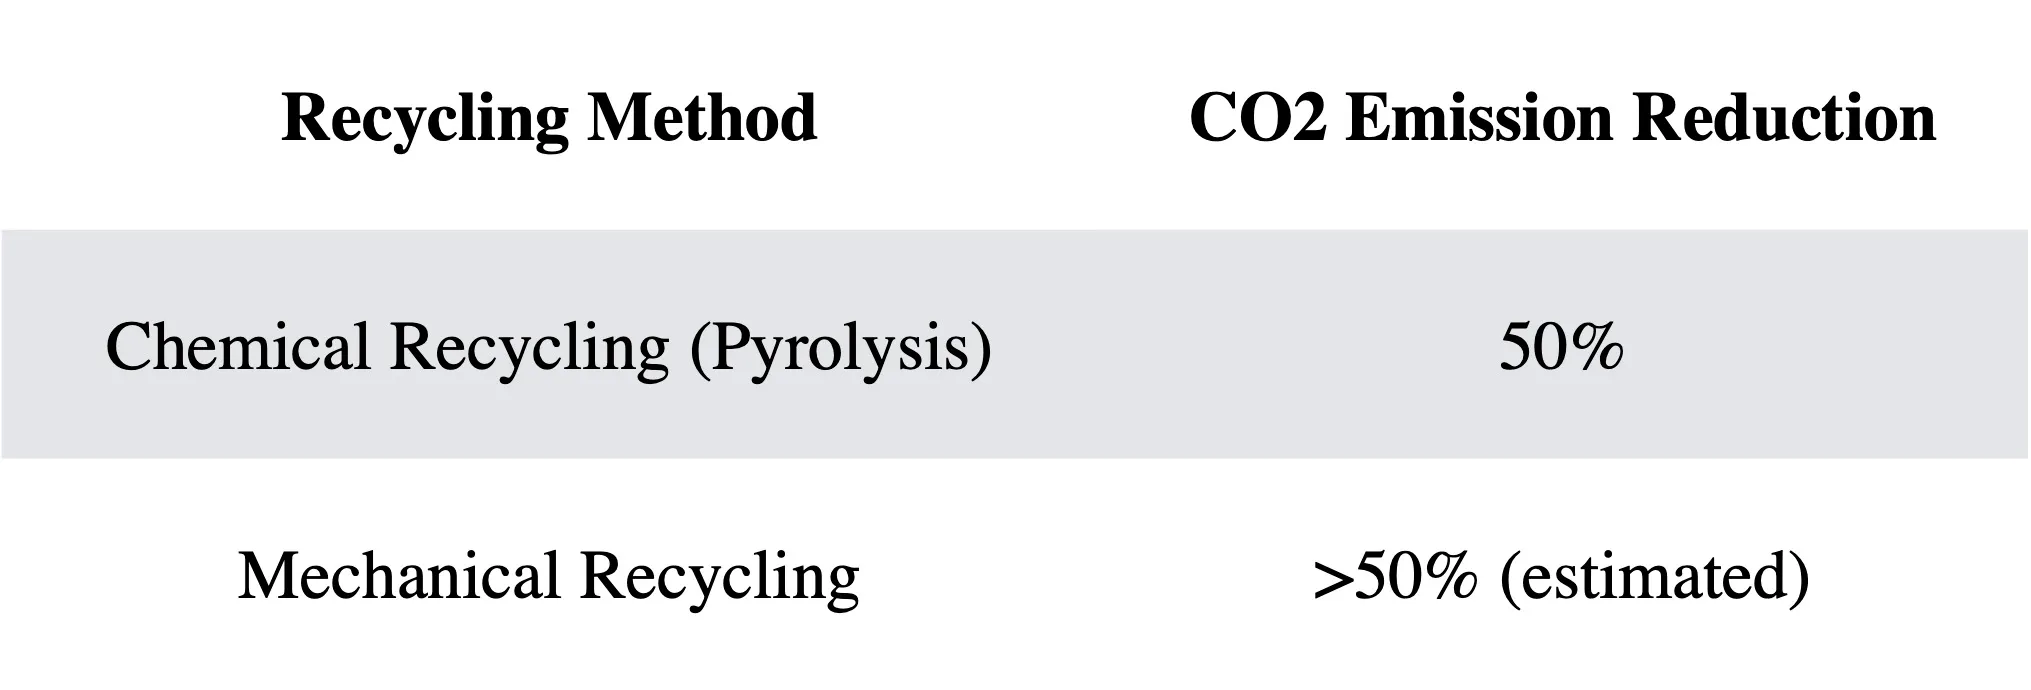
Yes, by a significant margin. Landfilling plastic waste generates methane (84x more potent than CO₂ over 20 years), risks groundwater contamination, and takes 400-1000 years to degrade. Pyrolysis converts this waste into usable products while reducing net greenhouse gas emissions by 50-80% compared to landfill. For tires, pyrolysis prevents toxic leachate and fire risks associated with tire dumps.
Modern pyrolysis plants with proper emission control systems produce emissions well within regulatory limits. Key controls include condensation systems for oil recovery, gas scrubbing for pollutant removal, and thermal oxidizers for residual gases. APChemi's plants are designed to meet EU-level emission standards. The syngas produced is typically used on-site for heating, making the process partially energy self-sufficient.
Pyrolysis is fundamentally different from incineration. Pyrolysis operates without oxygen, recovering materials (oil, char) rather than burning them. Incineration destroys materials entirely and produces higher emissions (dioxins, furans). Pyrolysis has a 50-80% lower carbon footprint than incineration and creates valuable products instead of just heat. The EU classifies chemical recycling via pyrolysis as higher on the waste hierarchy than energy recovery (incineration).
Yes, particularly through two pathways: (1) Biomass pyrolysis produces biochar, which sequesters carbon for hundreds of years — this is recognized as a legitimate Carbon Dioxide Removal (CDR) method. (2) Converting waste plastics into pyrolysis oil displaces virgin fossil feedstock, reducing net emissions. With ISCC Plus certification, these carbon benefits can be quantified and monetized through carbon credit markets.
Requirements vary by jurisdiction but typically include: environmental impact assessment (EIA), air emission permits, waste processing license, water discharge permits (if applicable), and noise assessment. In the EU, plants may fall under the Industrial Emissions Directive (IED). In the US, Clean Air Act permits apply. APChemi designs plants to meet the strictest standards and supports clients through the full permitting process.
Get a Free Consultation
Tell us about your pyrolysis project and our engineers will get back to you within 24 hours.
Get a Free Project Assessment →Explore More
Biochar & Carbon Removal
How biochar enables permanent carbon dioxide removal.
ISCC Certification
Certify your environmental impact for premium markets.
Chemical Recycling
How pyrolysis fits in the circular economy.
Decarbonization
Replace fossil fuels in heavy industry with biocoal.
ROI Calculator
Include carbon credits in your financial model.
Contact APChemi
Discuss the environmental profile of your project.