Why Your Business Plan Makes or Breaks Funding
Pyrolysis plants are capital-intensive and unfamiliar to many lenders. A generic business plan template won't cut it — investors and banks need to see industry-specific proof points that demonstrate you understand the technology, the market, and the risks. The quality of your business plan directly determines:
Financing Terms
Strong plans secure 60-70% debt at favorable rates. Weak plans get rejected or offered punishing terms.
Time to Funding
Well-structured plans close in 2-3 months. Incomplete plans cycle through revisions for 6-12 months.
Investor Confidence
Data-backed plans (from real feasibility studies) signal professional execution and lower risk.
🚫 Top Reasons Pyrolysis Business Plans Get Rejected
Vendor yield claims used as projections — banks want independent test data
No feedstock supply agreements — revenue means nothing without guaranteed input
Missing offtake contracts — producing oil is useless if no buyer is confirmed
Single-scenario financials — no sensitivity analysis = no risk awareness
Unproven technology partner — first-time equipment with no track record
No permitting plan — regulatory delays are the #1 schedule killer
The 6 Sections of a Bankable Business Plan
Every bankable pyrolysis business plan follows this structure. Each section must be backed by data — ideally from a comprehensive feasibility study with actual feedstock test results.
Executive Summary
The most critical section — often the only part investors read initially
- Business concept: what feedstock, what products, what scale
- Market opportunity: waste problem you solve + product demand
- Financial highlights: CAPEX, revenue, ROI, payback period
- Funding request: how much, what for, what return offered
- Team and technology partner (APChemi) credentials
- Implementation timeline: months to first revenue
Market Analysis
Prove the demand for both waste processing and output products
- Feedstock market: waste volumes, disposal costs, supply agreements
- Product markets: pyrolysis oil, biochar, carbon black pricing
- Competitor analysis: existing waste processors and recyclers
- Regulatory tailwinds: EPR mandates, landfill bans, carbon pricing
- ISCC/certification premium pricing opportunities
- Customer identification: refineries, asphalt plants, cement makers
Technology & Operations
Demonstrate you've selected proven, bankable technology
- Technology selection rationale (batch vs continuous, reactor type)
- Process flow diagram: feedstock in → products out
- Plant specifications: capacity, utilities, footprint, staffing
- Technology partner credentials (APChemi: 49+ plants, 12+ patents)
- Quality control and product specifications
- Health, safety, and environmental compliance plan
Financial Projections
The numbers that make or break your investment case
- CAPEX breakdown: equipment, civil, electrical, commissioning
- OPEX model: feedstock, energy, labor, maintenance, overhead
- Revenue model: product yields × prices × operating days
- 5-year pro forma P&L, cash flow, and balance sheet
- Key metrics: IRR, NPV, payback, DSCR, break-even analysis
- Sensitivity analysis: best case, base case, worst case scenarios
Risk Management
Show investors you've identified and mitigated risks
- Technical risks: equipment reliability, yield variability
- Market risks: price volatility, demand shifts, competition
- Supply risks: feedstock availability, quality consistency
- Regulatory risks: permit delays, policy changes
- Mitigation strategies for each risk category
- Insurance requirements and contingency reserves
Implementation Plan
A credible timeline from funding to revenue
- Project phases: feasibility → design → procurement → construction
- Gantt chart with milestones and dependencies
- Permitting and regulatory approval timeline
- Commissioning and ramp-up schedule
- Key personnel hiring plan
- Total timeline: typically 12-24 months to first production
Techno-Commercial De-Risking Process
Validate the technology and economics before committing the bulk of your investment
- 1
Commit 5–8% of CAPEX
Based on a preliminary financial model — your only spend before the Go/No-Go decision.
- 2
Pilot Plant Validation at APChemi's R&D
Pyrolysis pilot testing Distillation & purification testing End-product sample approval by buyer - 3
Engineering Cost Estimation by APChemi
CAPEX & OPEX calculations 50–60% engineering completion incl. critical simulations - 4
Financial Modeling & DPR with 3rd-Party CA
NPV / IRR analysis Sensitivity analysis
Go / No-Go Decision
No-Go
Revisit pilot testing or engineering — refine and re-validate before re-deciding.
Go
Commit the balance 93–95% of CAPEX with the technology and economics already de-risked.
APChemi helps clients develop bankable business plans backed by real project data from 49+ pyrolysis plants. Our feasibility studies and financial models are designed to meet investor and bank requirements.
Building Your Financial Model
The financial section is the most scrutinized part of any pyrolysis business plan. Here's what a credible model must include:
5-Year Financial Model Structure
Year 0: Capital Investment Phase
CAPEX drawdown schedule, construction milestones, working capital requirements. Show month-by-month cash outflows.
Year 1: Ramp-Up (Monthly Detail)
60-70% capacity utilization in Year 1. Show monthly ramp from commissioning to steady-state. Include startup costs and learning curve.
Year 2: Optimization (Quarterly Detail)
80-90% capacity. Optimization improvements, potential ISCC certification revenue, established supply chains.
Years 3-5: Steady State (Annual Detail)
85-95% capacity. Full revenue streams including carbon credits, maintenance schedules, potential expansion planning.
| Financial Metric | What Investors Look For | Typical Pyrolysis Target |
|---|---|---|
| Internal Rate of Return (IRR) | Above their hurdle rate | 20-35% |
| Payback Period | Under 5 years preferred | 2-4 years |
| Net Present Value (NPV) | Positive at discount rate | 1.5-3x CAPEX (10-yr) |
| Debt Service Coverage (DSCR) | Above 1.2x minimum | 1.3-1.8x |
| Gross Margin | Healthy and sustainable | 40-60% |
| Break-Even Utilization | Low enough for safety margin | 50-65% |
Sensitivity Analysis — The Section Investors Read Twice
No projection is certain. Sophisticated investors skip straight to your sensitivity analysis to understand how robust your returns are. Model at minimum these three scenarios:
Best Case
- • 95% capacity utilization
- • ISCC premium pricing (+20-30%)
- • Carbon credit revenue active
- • Feedstock cost at lower range
- • Oil price at upper range
Typical IRR: 30-45%
Base Case
Primary- • 85% capacity utilization
- • Market-rate product pricing
- • Conservative yield estimates
- • Average feedstock and oil prices
- • Standard operating costs
Typical IRR: 20-30%
Worst Case
- • 70% capacity utilization
- • Discounted product pricing
- • Feedstock cost at upper range
- • Oil price at lower range
- • 10% CAPEX overrun
Typical IRR: 10-18% (still positive)
Pro tip: If your worst case still shows a positive IRR and reasonable payback, your project is fundable. Investors don't expect perfection — they want to see you've stress-tested the numbers and the project survives downside scenarios.
Funding Sources for Pyrolysis Projects
Pyrolysis plants can access multiple financing channels. The right mix depends on your project size, location, and whether you have ISCC or sustainability certification:
Project Finance (Bank Debt)
60-70% of CAPEXAdvantages
Lower cost of capital, retains equity
Challenges
Requires bankable feasibility, collateral, and offtake agreements
Best For
Established operators with existing assets
Equity Investment (VC / PE)
100% or equity portionAdvantages
No collateral required, strategic value-add
Challenges
Dilutes ownership, higher return expectations (20%+ IRR)
Best For
High-growth projects with ISCC/carbon credit upside
Green Bonds / Sustainability Loans
50-80% of CAPEXAdvantages
Lower interest rates, longer tenors, impact alignment
Challenges
Requires sustainability certification/reporting
Best For
ISCC-certified or CDR-eligible projects
Government Grants + Subsidies
10-40% of CAPEXAdvantages
Non-dilutive, signals government support
Challenges
Competitive application process, reporting requirements
Best For
Circular economy / waste-to-energy in supportive jurisdictions
Pitching to Investors — What to Emphasize
Pyrolysis sits at the intersection of three megatrends that resonate with modern investors. Frame your pitch around these themes:
Circular Economy
Waste becomes feedstock. Products replace virgin materials. Aligned with EU Green Deal, EPR mandates, and corporate sustainability goals.
Carbon Markets
ISCC certification unlocks premium pricing. Biochar CDR generates carbon credits. Carbon border taxes (CBAM) create structural demand.
Waste-to-Revenue
Dual revenue: gate fees for waste acceptance + product sales. Growing waste crisis = growing feedstock supply. Counter-cyclical fundamentals.
How APChemi Strengthens Your Business Plan
A business plan is only as strong as the data and credentials behind it. APChemi provides both:
Bankable Feasibility Data
Our feasibility studies include actual feedstock test results, validated yield data, and ±10-15% CAPEX accuracy — the foundation investors demand.
49+ Project References
Lenders can verify APChemi's track record across 49+ commercial plants worldwide — proof that the technology partner can deliver.
ISCC Certification Expertise
We've guided 4 plants through ISCC PLUS certification (+1 coming up) — opening green finance channels and premium product pricing for your plan.
End-to-End Execution
APChemi manages projects from feasibility through commissioning — eliminating the technology risk that concerns most lenders.
Business Plan Checklist
Before submitting your plan to investors or banks, ensure every item below is covered:
Final Review Checklist
Powered by APChemi — Your Technology Partner for Bankable Projects
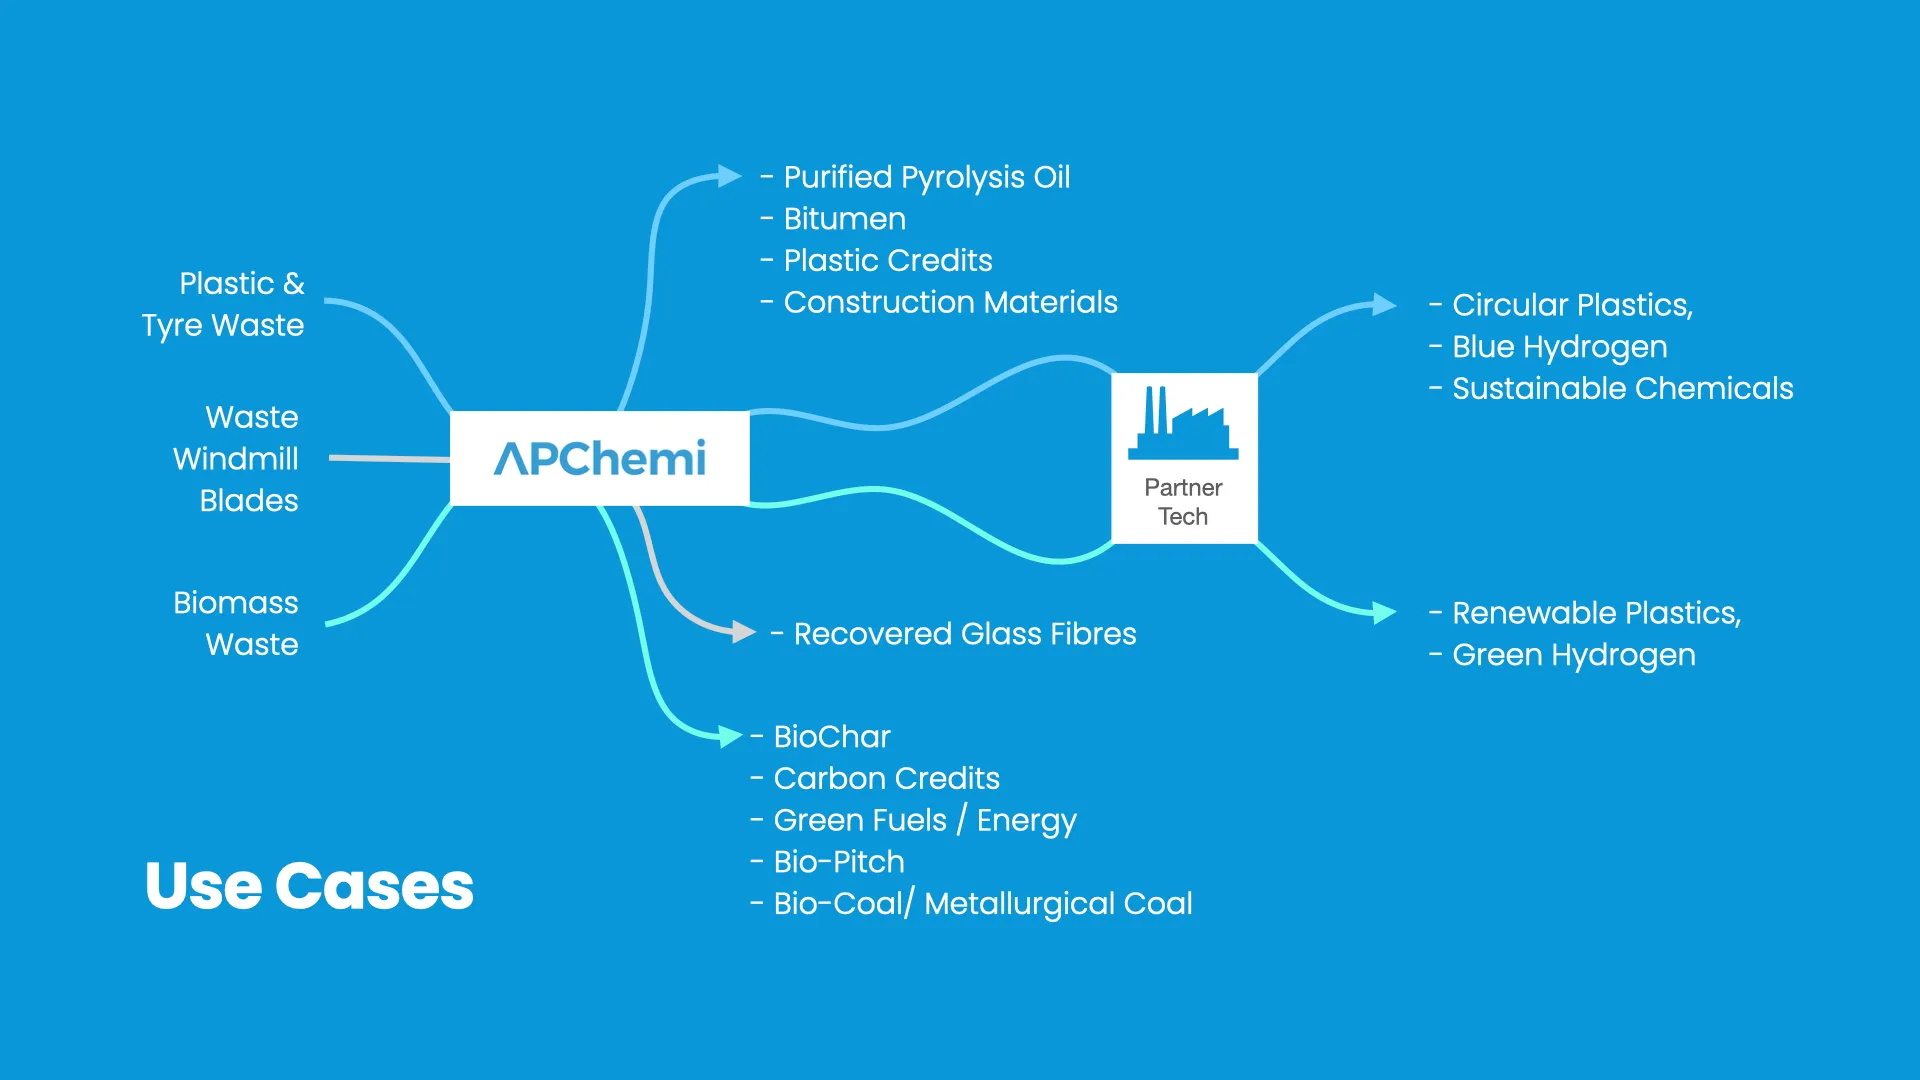
Find Technology Partners
Identify potential technology partners, feedstock suppliers, and off-takers for your pyrolysis business plan.
Frequently Asked Questions
A complete business plan typically runs 40-80 pages including appendices. The executive summary should be 2-3 pages. For investor presentations, prepare a 15-20 slide pitch deck as a companion. Quality matters more than length — every section should be backed by data, preferably from a feasibility study with actual feedstock test results.
Investors expect a detailed 5-year pro forma with monthly Year 1 cash flows, quarterly Year 2, and annual Years 3-5. Key metrics they evaluate: IRR (target 20%+), payback period (under 3-4 years), NPV at their hurdle rate, debt service coverage ratio (DSCR above 1.3x), and sensitivity analysis showing break-even points on feedstock cost, oil price, and capacity utilization.
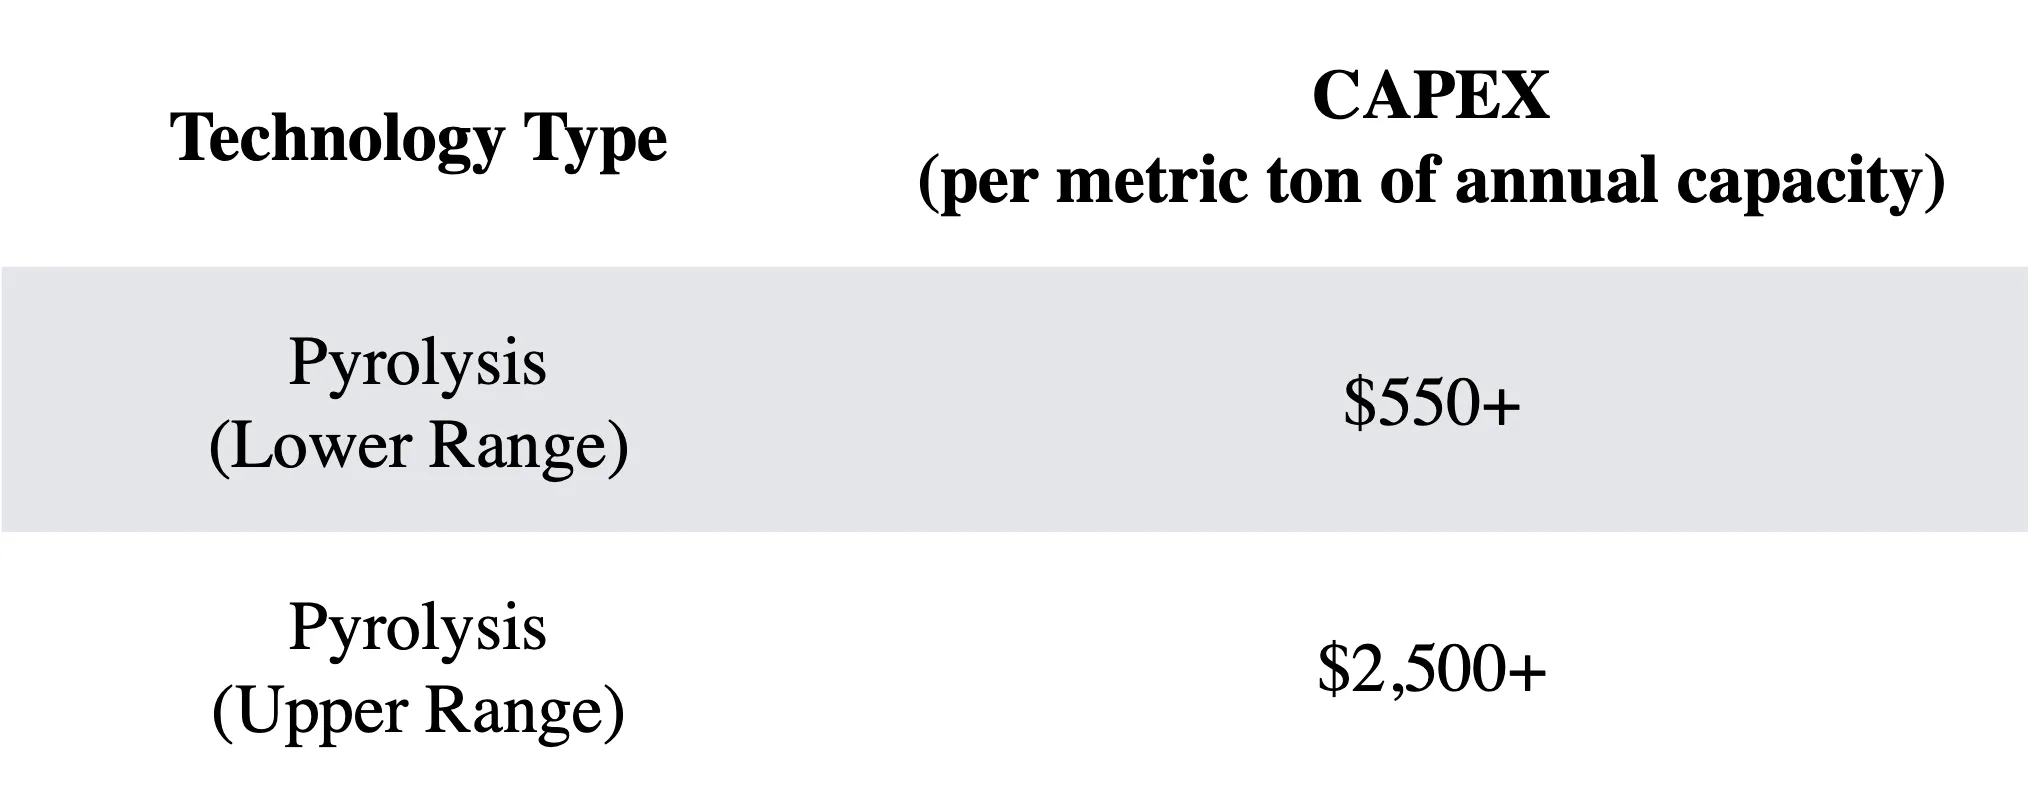
Total capital requirements depend on scale: a 5 TPD batch plant needs $200K-$500K total, a 20 TPD continuous plant needs $1M-$3M, and a 50+ TPD fully automated plant with oil purification needs $3M-$10M+. Plan for 15-20% contingency above CAPEX estimates. Working capital needs are typically 3-6 months of operating costs. APChemi can provide bankable CAPEX estimates based on actual project experience.
Yes, but banks require a bankable feasibility study, proven technology references, feedstock supply agreements, and offtake agreements for products. Typical financing structures: 60-70% debt, 30-40% equity. Green finance and sustainability-linked loans may offer better terms. ISCC certification significantly strengthens financing applications. APChemi's track record of 49+ plants helps de-risk lending decisions.
Many jurisdictions offer grants, tax incentives, or subsidized loans for waste-to-energy and recycling projects. Common programs include circular economy funds, renewable energy subsidies, carbon reduction grants, and waste management infrastructure funding. The availability varies significantly by country and region. Your business plan should identify all applicable incentives — APChemi can help navigate programs in your jurisdiction.
Get a Free Consultation
Tell us about your pyrolysis project and our engineers will get back to you within 24 hours.
Get a Free Project Assessment →Explore More
ROI Calculator
Model your project's financial returns interactively.
Feasibility Study Guide
The data foundation your business plan needs.
Pyrolysis Plant Cost
Detailed CAPEX and OPEX breakdown by plant type.
ISCC Certification
How certification transforms your revenue model.
Case Studies
Real-world project examples to strengthen your plan.
Choosing a Manufacturer
Include manufacturer evaluation in your business plan's technology section.